
A is for aversion and it’s an interval (for now)
You already have the letters
Last post we talked about tickets, the tickets were the measurement. To make things easy, we used a table. The table had two sleeves and ten rows. Each row had a payout with known probabilities. Your job was to choose A or B. This table measures risk-aversion (or non-aversion to it). Is it subjective? Yes. Is it helpful? Absolutely.
If you looked through the questions, made your choices, and followed through you would have gotten your measurement and your switch
I promised that the switch comes next, and that the switch is a range.
This post explains what that range is.
A is aversion
A is for aversion, it’s how long you stayed in the tighter sleeve to avoid the low payout of $500.
Remember that usefulness of wealth is a curve. We did the math to prove it. If you want to work through it again, that post is here (https://www.confluentresearch.com/wealth-its-usefulness-and-the-cost-of-a-fair-coin/). A sure amount can beat a fair coin because a dollar lost is not the flip side of a dollar gained.
With that said, let’s do a quick review of the table. The cleanest example is looking at Row 5.
On row 5 the wide sleeve starts paying more in expected dollars (remember expected value?). A picker who only counts expected dollars switches there. That picker is not afraid of the $500 and is not in love with the $19,250. They follow the arithmetic. In the lab, that picker’s A (aversion) is at zero. That’s the risk-neutral switch.
If you stayed on the tight sleeve after row 5, you left expected dollars on the table. You paid in expected dollars to keep the worst-case payout at $8,000 instead of $500. One extra row is a small payment. Two extra rows become a larger one. The letter A is that payment. The longer you stayed, the higher the A (i.e. the higher your aversion to risk).
If you jumped to the wider sleeve before row 5, you did the opposite. You gave up expected dollars to chase $19,250, and you’re taking the risk of a lower $500 payout to do it. That is a negative A. You were paying for the potential upside.
We’ve seen this before, without the letter. A sure $100,000 against a fair coin of $80,000 and $120,000. Preferring the sure amount is the same instinct as staying on the tight sleeve. The bad print costs more, in usefulness, than the good print pays. The table does the same thing. Indifference is when the two sleeves are tied
We’ve been talking about usefulness a lot on this series.
On this post we gave it a formula and an interactive chart. The same idea applies here, for this table. We need to calculate the usefulness of a payoff, same concept, slightly different formula.
The usefulness of a payoff is this:
At A = 1 that denominator is zero, so the formula breaks. The lab uses the natural log there instead:
To clearly illustrate the math, let’s look at my particular example.
I took sleeve A on rows 1 through 6. On row 6 the chance of the good print is 60 percent. That chance is p. The other side to that is 1-p.
I switched to sleeve B on row 7. On row 7, p is 70 percent. I stayed on B after that.
Indifference is when the two tickets are equally useful. Usefulness of sleeve A equals usefulness of sleeve B. You would just as soon take either one. You are indifferent.
I was not indifferent on row 6. I still took A (more risk averse). My aversion is higher than the tie at 60 percent. That tie is A*(0.60). It is 0.41.
I was not indifferent on row 7. I had already taken B (less risk averse). My aversion is no higher than the tie at 70 percent. That tie is A*(0.70). It is 0.68.
The tie for my particular case sits between those two rows. 0.41 < A ≤ 0.68. That is an interval. It is my worked example. Yours will be different.
A = 1 is the log, because the power formula divides by zero. That is a math patch. It has nothing to do with the last row being a sure thing.
The final row
Row 10 is not a coin flip. It is sure $10,000 against sure $19,250. Read the two amounts. There is no bend that makes $10,000 the better sure thing. No rational person will pick a sure $10,000 against a sure $19,250.
Last A, first B
A risk averse investor who understood the tickets switches once. A run of A’s, then a run of B’s. They do not go back. They do not alternate.
The choice is the expected dollars, and the spread around those expected dollars. Sleeve A is the tight spread. Sleeve B is the wide one. As p rises, the wide sleeve’s expected dollars catch up, then pass. A clean book stays on the tight sleeve until those extra expected dollars are enough to pay for the wider spread. Then it moves, and it stays.
The last A is the floor. Aversion is above A* on that row. The first B is the ceiling. Aversion is at or under A* on that row. Do not average the two edges into a point.The worked example
Here is one clean book, so the arithmetic is visible. Last A on row 6. First B on row 7. At 60 percent the torn A is 0.411456. At 70 percent it is 0.676180. So the interval is 0.41 < A_HL ≤ 0.68.
That band is an example. My particular case. Again, yours will be different (or not). It is not the answer key. It is not the household. If your letters are different, you are on a different row of the table. If your letters jump twice, you’re doing a different assignment.
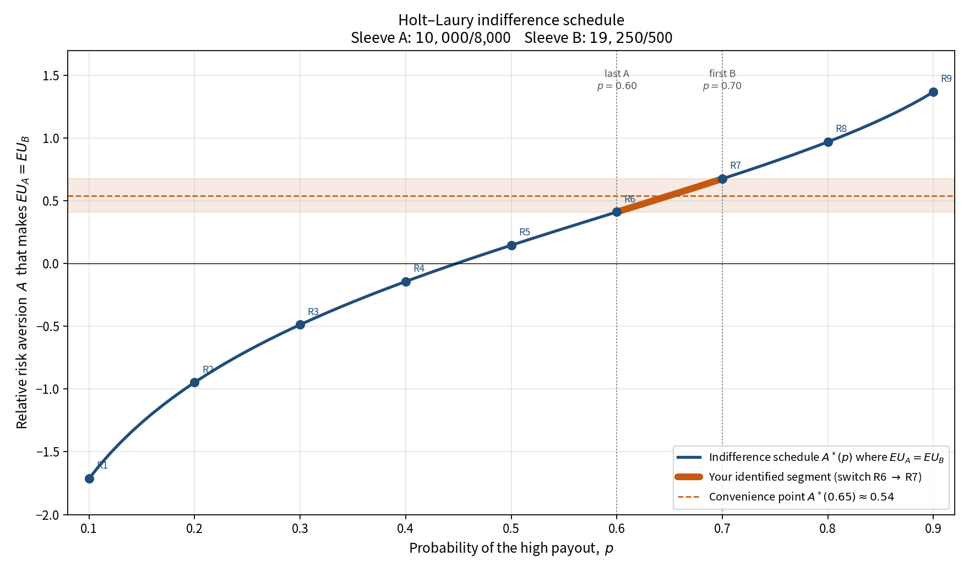
Figure. A*(p) from p = 0.10 to p = 0.90. The shaded band is the worked example, 0.41 < A_HL ≤ 0.68. It is not the reader’s interval. There is no point at p = 1.
Find your row — if the book is clean
One switch, and it sticks. Last A, then first B, and no return to A. That is the only book this table scores.
| Clean switch | Interval on A | How to read it |
| Never A. First B on row 1 | A_HL ≤ −1.71 | Risk loving. No floor on the instrument. |
| A on 1, then B | −1.71 < A_HL ≤ −0.95 | Still paying for the wide sleeve early. |
| A on 1–2, then B | −0.95 < A_HL ≤ −0.49 | Wide sleeve before the EV flip. |
| A on 1–3, then B | −0.49 < A_HL ≤ −0.14 | Still before the expected-dollar switch. |
| A on 1–4, then B on 5 | −0.14 < A_HL ≤ 0.15 | Neighborhood of the expected-dollar picker. Zero sits in here. |
| A on 1–5, then B | 0.15 < A_HL ≤ 0.41 | Stayed on A one row after EV flipped. |
| A on 1–6, then B on 7 | 0.41 < A_HL ≤ 0.68 | Worked example. Not your score. |
| A on 1–7, then B | 0.68 < A_HL ≤ 0.97 | Paid two extra rows to keep the $8,000 floor. |
| A on 1–8, then B | 0.97 < A_HL ≤ 1.37 | Log bend is inside this band, not a prize. |
| A on 1–9, then B on 10 | A_HL > 1.37 | No ceiling. Instrument stops. Do not invent one. |
| A on all ten, including row 10 | Do not score | Sure $10,000 vs sure $19,250. Dominance fail. |
Gold row is the worked example. Zero sits in the row-5 band, with the expected-dollar picker. A = 1, the log, sits inside 0.97 < A_HL ≤ 1.37. It is a math patch, not a badge.
What the interval is not
It is not a personality. This interval does not do that.
It is not capacity. The plan, the reserve, the job, the house — none of that was discussed here.. Ability is a different conversation.
It is not a weight. It gives you a range, an idea of where you are relative to others or to where you are year over year (because things do change).
Next
Today we have a range. Next we try to give you a point estimate based on this interval.
Stay tuned!
